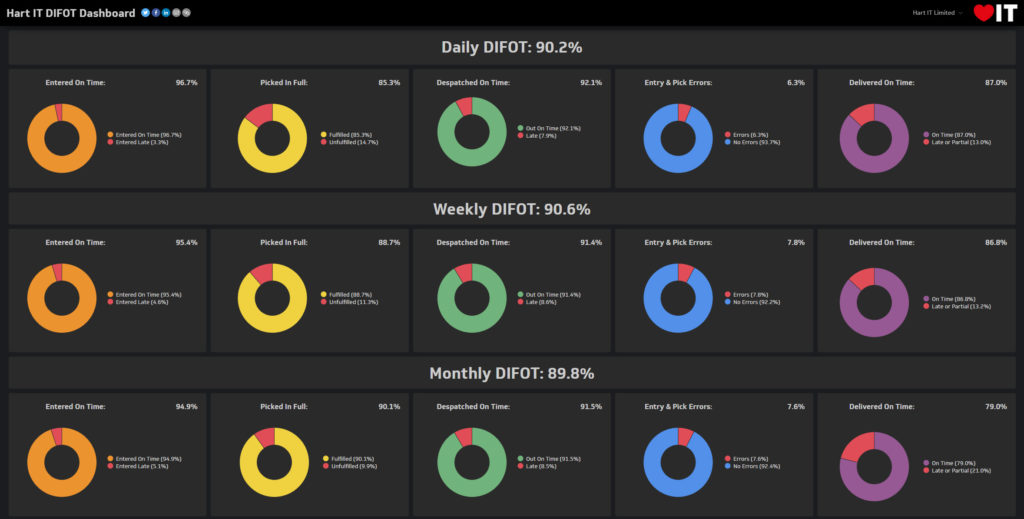
A dashboard is the ideal tool to simultaneously record your DIFOT drivers from a wide variety of sources, use them to calculate your DIOFT and display them to the team.
This example is adapted from one we setup for a Warehousing company. They measured their DIFOT Using 5 measures.
Entered on Time; when a sales order was keyed into the ERP we added a mandatory drop down field that recorded how long since the order had been received.
Picked in Full; this is the percentage of order lines that weren’t able to be fulfilled on the first order. Backorders are excluded from this measure.
Despatched on Time; the company had a policy of an order leaving their warehouse no more than 24 hours from the time it was ordered. Using the hours between order entry and despatch, combined with Entered on Time data, let us calculate what % of orders were meeting this target.
Entry & Pick Errors; to gather data on this we setup web forms that staff could use to record any errors. As well as using this data to give a DIFOT figure the information can be used to analyse repeat errors and remediate them.
Delivered on Time; the data for this comes from freight company reports that were entered using another web form. because this data is often 2 – 4 weeks old, a sub set of it is used for daily and weekly DIFOT figures.
All of the above are gathered automatically with a combination of web forms and direct queries to the companies ERP and WMS. Additionally the company decided to weight the final DIFOT figure by placing more importance on some measures, this was also built into the dashboard.
RESULT: an easy to read dashboard that has driven the Operations team to improve their performance by a measurable amount, leading to accountability and improved outcomes for both staff and business.